By Karen Gleason
The 830 Times
Several hundred Del Rioans participated in a survey over the past year to let city council members know where some of the city’s money should be spent.
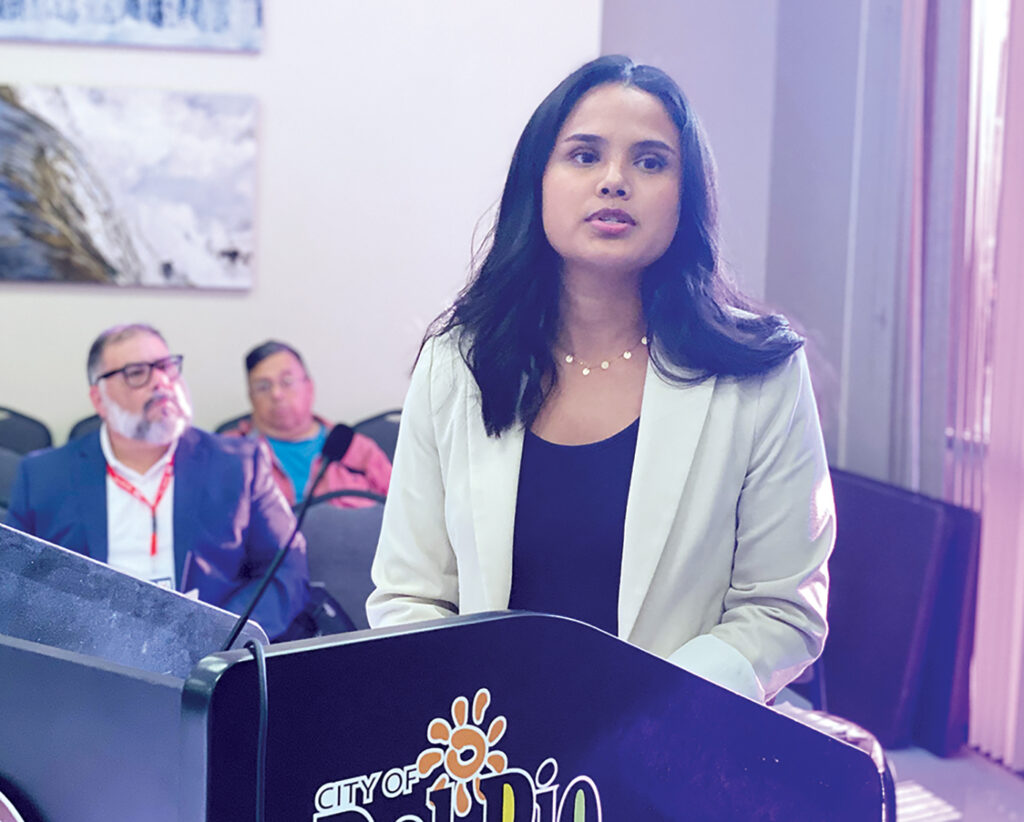
Roxy Soto, city budget analyst, presented the results of the annual community budget survey to the city council during the council’s July 25 meeting.
“For the past three to four years, administration and finance have been (conducting) the community budget survey to gather information on budget priorities and the level of satisfaction with city services. It’s important for us to gather this information so that we know how we shape our budget and also so that we use it within our budget guidelines,” Soto told the council.
“This information is included in the city’s budget book and is used as a form of transparency and efforts made to include the citizens of Del Rio (in the budget process). And lastly, we wanted to compare this year’s survey results with last year’s, and we will get to that near the end of the presentation,” she added.
Soto discussed the methods used to distribute the survey, including Google Survey and posting on the city of Del Rio’s Facebook page. She said it was also emailed to all city staff members, included in staff members’ email signatures, distributed as a QR code at the ‘Field of Our Dreams’ sports park ribbon cutting event and sent out as a text message on the Regroup notification system.
The survey was distributed and participation solicited for about eight weeks from March through May, Soto said.
Despite efforts to widely disseminate the survey, however, it drew only 289 respondents.
“Last year we averaged 70 to 71, so we did do a little bit better this year,” Soto said.
She noted the questions in the survey were developed to focus on four strategic areas that serve as the guiding framework for the city budget: governance and organizational, excellence, economic development, transportation and mobility and quality of life.
“So for quality of life, we looked at arts and cultural resources, and we asked the community, ‘What do you believe are the highest priorities?’” Soto said.
Under arts and cultural resources, Soto said, the community voted its highest priorities as historic preservation, including a façade assistance program for historic buildings on South Main Street, development of the Downtown Historic District and murals.
Development of civic facilities and entertainment venues was a close second, and third was marketing and promoting existing arts and cultural programs and events.
Under the category of parks and open spaces, the survey’s three highest priorities were current park maintenance and improvements, San Felipe Creek Walk remediation and community walking tracks, Soto said.
Another question the survey asked under parks and open space, Soto said, was if respondents preferred the city spend its money on more splashpads or pools, and 54 percent said they preferred splashpads.
Priorities identified under community character and placemaking were identified as beautification and cleanup through ordinance enforcement; issues such as lot abatement, junked vehicles, dilapidated structures and excessive parking. Respondents also identified streetscape treatments such as enhanced paving, street furniture like benches, light posts and road signs, and accent lighting and public stormwater runoff and drainage as top priorities.
The three highest priorities in the safe, vibrant and healthy neighborhoods category were abatement of littering and debris, vacant buildings and overgrown vacant lots.
Under the category of governance and organizational excellence, the three top priorities were identified as ease of reporting issues and making service requests, community engagement and outreach activities and the ability of citizens to communicate with departments.
Soto also reviewed the results of a portion of the survey that asked respondents if they had called a particular city department and asked them to indicate the number of times they called before receiving assistance.
She said most of the respondents indicated they had never made contact with a city department over the past year, and noted that, “For the most part, we saw our results were getting neutral or staying the same on how many times they called before they received an initial response.”
Survey respondents also were asked to rate “the attitude of your customer service experience.”
“For almost all of the departments, the answer was ‘fair,’ and the police department’s was ‘good,’ and had the highest ranking. Compared to last year, it was relatively the same,” Soto said.
She also noted it was difficult to compare year-to-year results because of the low number of survey respondents last year.
Similar results were seen in survey respondents’ ratings of the helpfulness and the satisfaction of their experiences interacting with city departments, with all departments except the police department rated as “fair.” The police department, Soto noted, received “good” ratings – higher than other departments – in both categories.
Most respondents, Soto said, rated the quality of their customer service experience as “fair.”
Soto also reviewed respondents’ top three priorities in the categories of “communication and transparency,” which were press release frequency, informational city text alerts and departmental roundtables, forums and discussions, and in the category of “community facilities and infrastructure,” which were investing in recreational facility upgrades and future expansions (Joe Ramos Center/new gym), access to additional outdoor activities (batting cages, pickle ball, foot and disc golf) and access and neighborhood improvement projects adjacent to existing schools (park or neighborhood playscapes).
Respondents’ top three priorities under “economic development” were downtown/Main Street revitalization, large business recruitment and youth skills/technical skills development, and the top three priorities under “transportation and mobility” were maintenance of city streets, sidewalk availability and traffic flow.
Soto also shared the results of the survey’s final question, which asked respondents to rank “your frequency of use for an airline, Amtrak and bus.”
“Most of the people who responded to the survey have not used these methods. The highest (use) was one or two times per year for the airline, Amtrak or bus,” Soto said.
The full community survey, including questions and results, was also included in the council’s packet.
After Soto finished her presentation and Mayor Al Arreola asked if council members had any comments, Councilwoman Alexandra Falcon Calderon said, “It is really sad to have only 289 respondents, so this is based on just those numbers. It seems like every survey the city puts out there, (the response) seems very, very low.”
Calderon said she knows the city has made various efforts to increase responses to surveys.
“The reason why we do these surveys is to engage the community and what we want to do is for the citizens and this is what we get,” she added.
Calderon also noted the majority of the questions on the survey are tied to the city’s economic growth. She noted the city recently moved from a Type A to a Type B economic development corporation and urged the city not to forget why that was done.
“Type B sales tax will mean a lot for these projects,” Calderon said.
City Manager John Sheedy also noted it is important for Del Rioans to participate in the surveys, pointing out the number of respondents more than doubled from last year to this year. He said the city will continue working to increase participation.
The council took no action following the presentation of the survey results.
—
Contact the author at delriomagnoliafan@gmail.com


